
Plots of Ship Movements
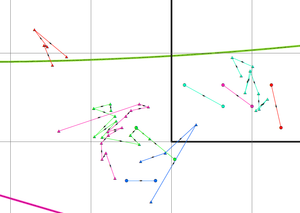
Here is an interesting example of plotting the GPS positions of ships, with varying symbology representing different recording systems and times.
The client required the information presented in a particular way - so we used the various 'meta-data' associated with the position (ie: the unit collection the information, the time of day, the primary sensor, etc) to meet their requirements.
The positions are plotted as points with connecting lines, which included a vector to provide direction of movement.
There is also an overlaid lat/lon grid, as well as other boundaries of interest (distances from points of land, administration regions, etc).
This visualisation helped the client solve a costly problem, demonstrating the power of even basic Geospatial Information Services.
